Reports
Review sales, inventory, expenses, and tax records.
DealerSpot reports help Owners and Admins understand dealership activity using the records your team already enters.
Complete your records first
Reports are only as accurate as the dealership records behind them. Before making a decision, check the transaction date, sale price, vehicle, expenses, taxes, branch, and assigned managers.
Choose a report
| What you want to know | Report |
|---|---|
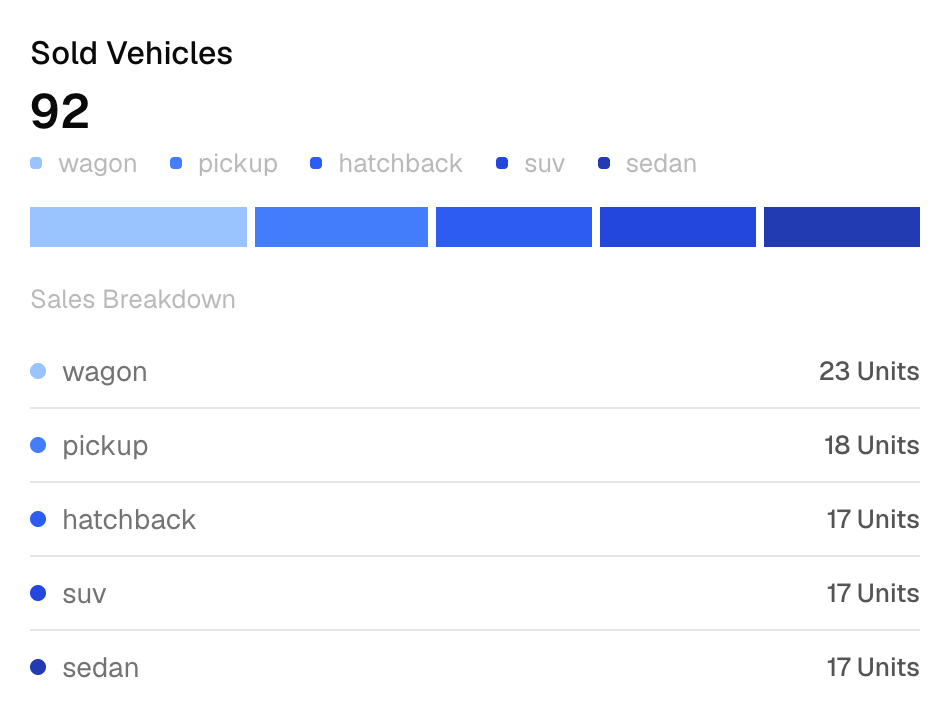
| Which vehicle types are selling? | Vehicle Type Distribution |
| How are sales changing each month? | Monthly Sales Performance |
| Who is assigned to completed deals? | Salesperson Performance |
| How do new and used sales compare? | New vs Used Sales |
| Which vehicle types bring in sales? | Vehicle Type Sales Analysis |
| How do months in a selected period compare? | Monthly Performance Overview |
| What types of vehicles are in inventory? | Vehicle Types |
| What remains after recorded vehicle costs? | Profit Analysis |
| Where are vehicle costs concentrated? | Operation Costs |
| What tax amounts are saved on deals? | Tax Report |
Choose what the report covers
Before reading a report:
- Choose one branch or All Branches.
- Choose the date range when one is available.
- Check the records behind any surprising number.
- Export the report when you need to save or share it.
Some reports use completed transactions and a date range. Others show the current state of your inventory or all recorded sold-vehicle costs. Read Metric Definitions when two reports seem different.
Export a report
Choose CSV when you want to sort or review the information in a spreadsheet. Choose PDF when you want a simple snapshot to share.
Write down the branch and date range with any export so others know what it covers.
Website traffic
Website Traffic is coming soon
The Website Traffic page may show sample information. Do not use it to measure storefront visits, vehicle views, or advertising results.
Storefront forms still create contact records for follow-up. Use those contacts to manage the lead, but not as a complete website traffic report.